

Consolidated Financial Highlights
Business Performance Over The Past 10 Years
Nov 14, 2025: FY25 Q2 Supplementary Financial Data
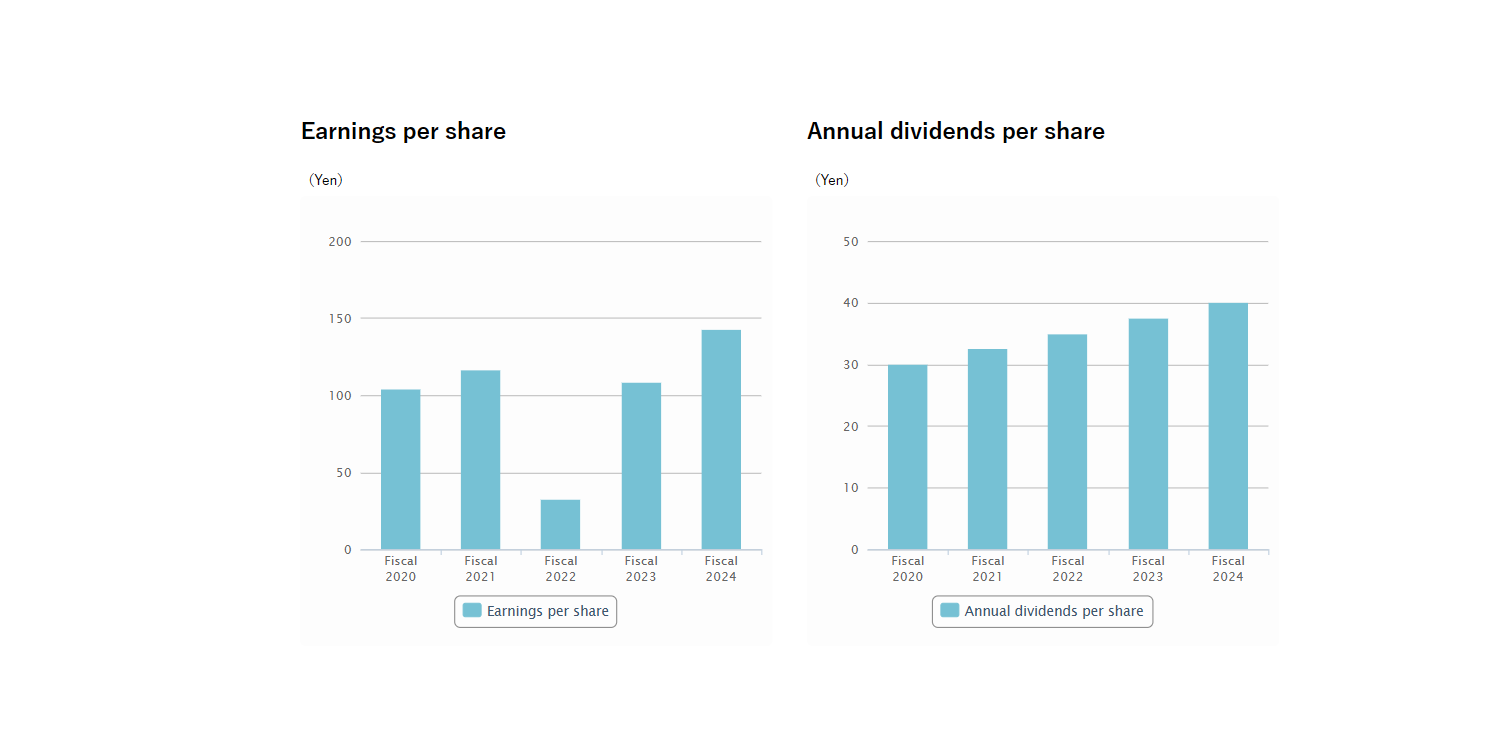
*Adjusted based on the 2-for-1 split implemented as of October 1, 2024. “EPS” and “Dividends” are expressed assuming that the stock split occurred at the beginning of FY2020.
| Years ended March 31, data in yen terms | IFRS | ||||
|---|---|---|---|---|---|
| Fiscal 2020 | Fiscal 2021 | Fiscal 2022 | Fiscal 2023 | Fiscal 2024 | |
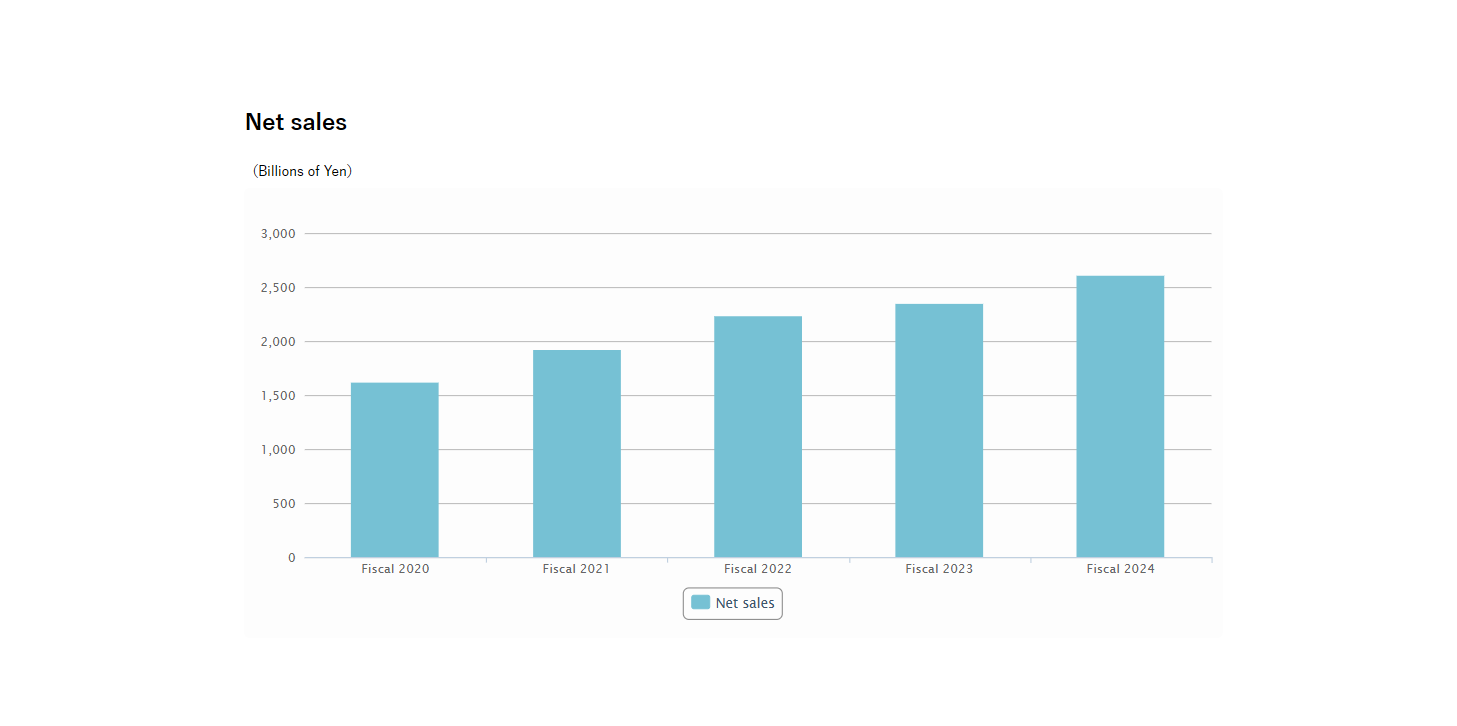
| Net sales (million yen) | 1,618,064 | 1,918,174 | 2,230,027 | 2,347,159 | 2,607,813 |
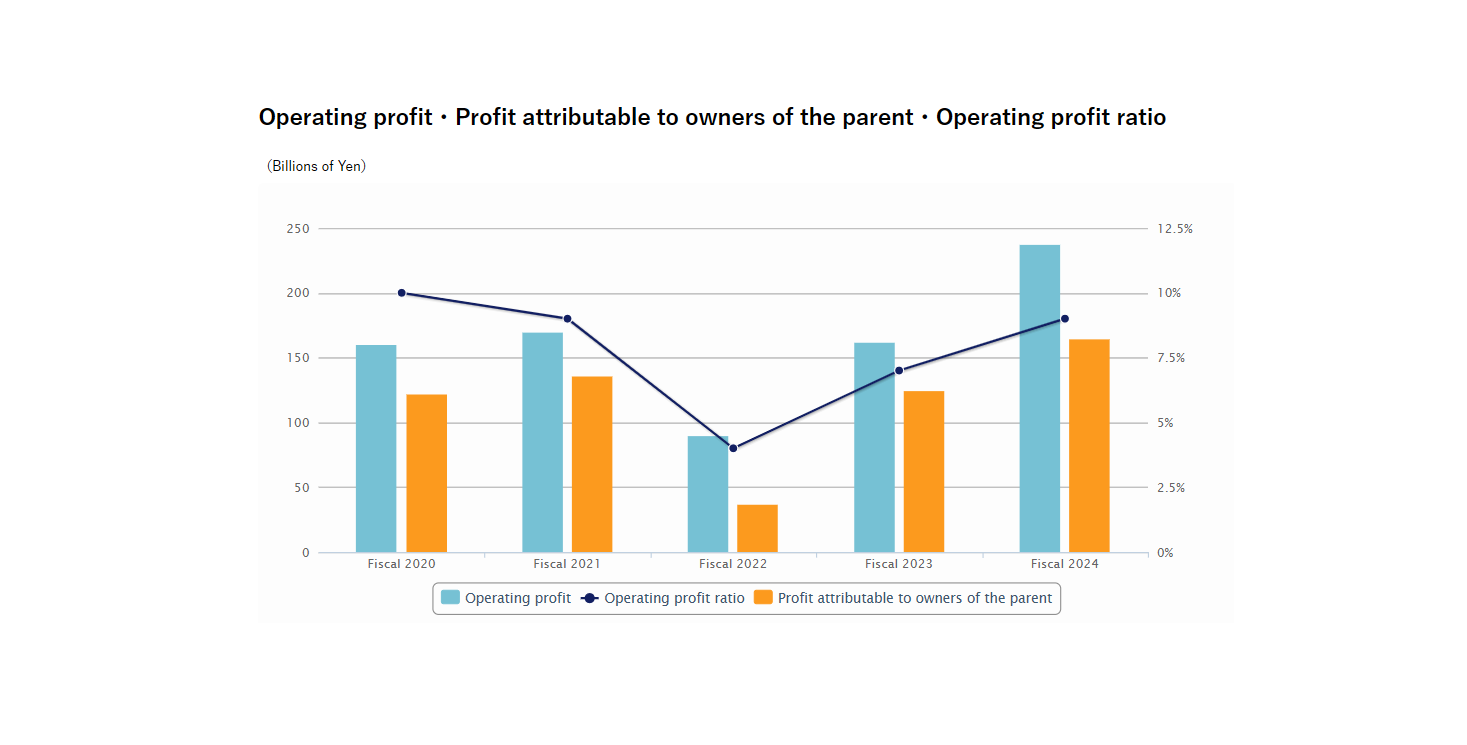
| Operating profit (million yen) [Operating profit ratio] | 159,970 [9.9%] | 170,374 [8.9%] | 89,923 [4.0%] | 161,856 [6.9%] | 237,837 [9.1%] |
| Profit before income taxes (million yen) | 152,937 | 170,032 | 110,435 | 201,669 | 233,030 |
| Profit attributable to owners of the parent (million yen) | 121,945 | 135,759 | 36,982 | 124,455 | 164,159 |
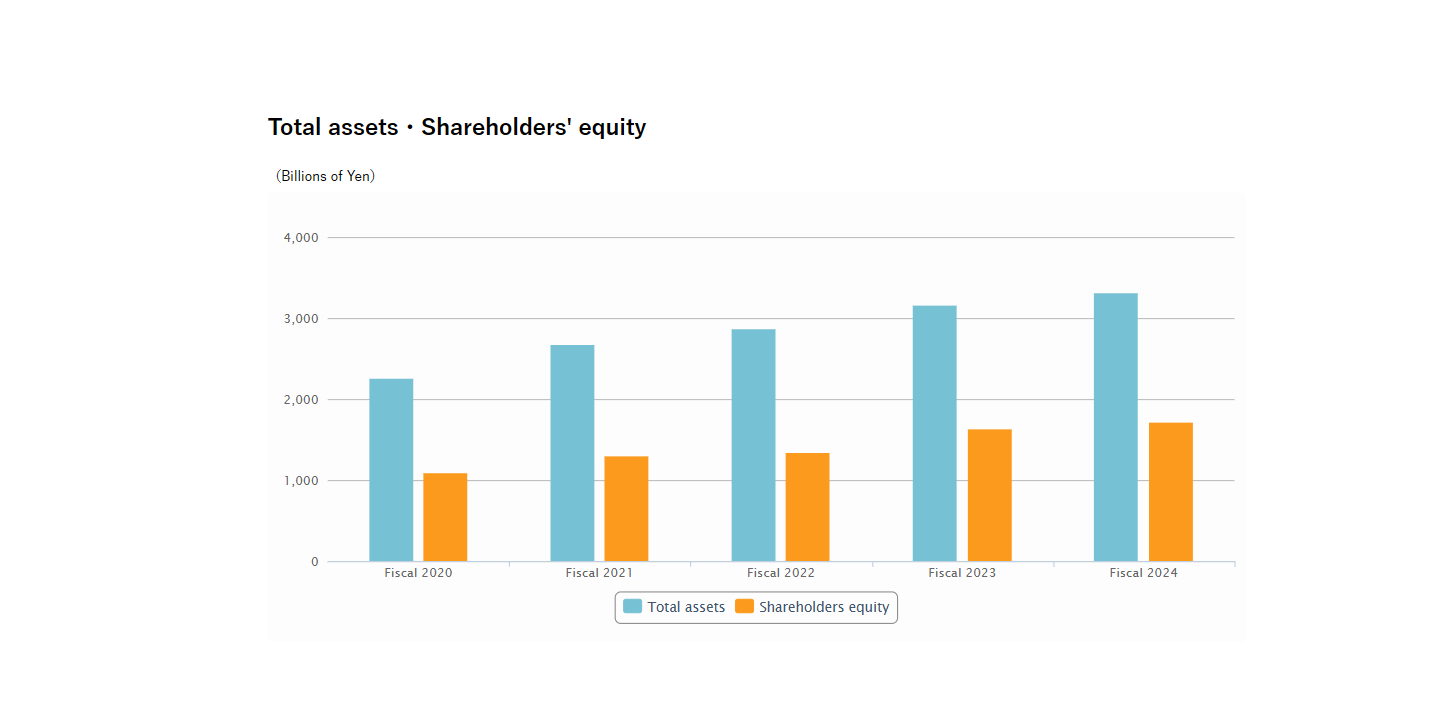
| Total assets (million yen) | 2,256,024 | 2,678,483 | 2,862,749 | 3,159,709 | 3,315,253 |
| Shareholders' equity (million yen) | 1,096,020 | 1,292,241 | 1,346,565 | 1,631,481 | 1,716,947 |
| R&D expenses [Ratio of R&D expenses to net sales] | 67,280 4.2% | 78,015 4.1% | 81,337 3.6% | 81,055 3.5% | 80,599 3.1% |
| Earnings per share (yen) * | 104.10 | 116.20 | 32.13 | 108.30 | 142.88 |
| Annual dividends per share (yen) * | 30.0 | 32.50 | 35.0 | 37.50 | 40.00 |